Preliminaries
Hypothesis
A statistical hypothesis is an assertion about a population parameter that can be tested. There are two main types of hypotheses: - Null Hypothesis (): The default assumption that there is no effect or no difference. For example, it might state that a new drug has no effect on patients. - Alternative Hypothesis (): This represents the opposite of the null hypothesis, suggesting that there is an effect or a difference
Two Types of Error
| Fact \ Decision | Accept | Reject |
|---|---|---|
| is true | Good | Type I Error |
| is true | Type II Error | Good |
Significance Level
Significance level, denoted , is the threshold for determining whether to reject the null hypothesis (i.e., the probability for Type I Error to occur). A common choice for is 0.05, meaning there is a % risk of concluding that a difference exists when there is none.
Rejection Region
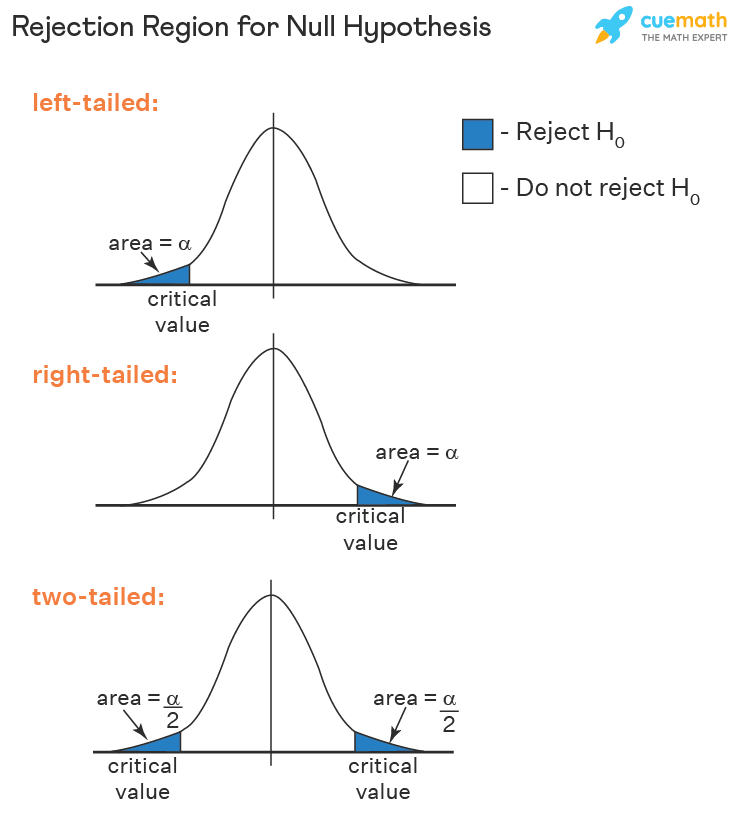
The rejection region (or critical region) is defined as the area on the distribution of the test statistic where, if the calculated statistic falls within this area, you would reject in favor of the alternative hypothesis ().
The critical values are the boundaries that separate the critical region from the acceptance region:
- The chosen significance level ()
- Whether the test is one-tailed or two-tailed.
We say that a rejection region has a size , if it ensures a significance level , i.e. the probability of making a Type I error should be lower than . In the plot of PDF plot, this is the total area of the critical region, as shown in the figure below

Definition
To generalize the hypothesis testing problem. Let and be the parameter spaces of when and are true, respectively. The hypothesis testing problem is: Let be a simple random sample, be the test statistic, be the significance level, and be the rejection region. Define the test as:
Test with Level
If
Then we call a test with level
Power of a Test
The power of a hypothesis test is a critical measure that reflects its ability to correctly reject a false null hypothesis (). That is , or
When is true, is the probability for type I error to occur; When is true, is the probability for type II error to occur. Therefore, if is true, then we would have . And when is true, we hope to be as big as possible. As a result, when is true, we call is the power of test at .
Uniformly Most Powerful Test (UMPT)
A Uniformly Most Powerful (UMP) test is defined as a hypothesis test that maximizes the probability of correctly rejecting the null hypothesis across all possible alternative hypotheses, while maintaining a fixed significance level . This means that for any alternative hypothesis, the UMP test has the greatest statistical power
-value
For a test at level , is the test statistic. After obtaining the sample, let the observed value of be . If the rejection region of the hypothesis is of the form , then the p-value is defined as
Additionally, for a rejection region of the form , the p-value is ; for a rejection region of the form , the p-value is . According to the shape of the rejection region, the p-value is the sum of the probabilities of those data that are more extreme (with a smaller probability of occurrence) than the observed data under the assumption that the null hypothesis is true ().
Warning
if is a discrete random variable, the sum must include the probability of the observed value. That is, use instead of
In other words, the p-value is the minimum significance level required to reject the null hypothesis based on the observed sample. That is
- If , we accept
- If , we reject
Note
If we can define a clear threshold for the hypothesis to be true, use the rejection region approach; if we can't, use the p-value approach
Common Testing Problems
- Simple Tests:
- Two-tailed Tests:
- One-tailed Tests:
- or
- or
General Steps
Below are the general steps for hypothesis testing, divided into four steps:
- Set the significance level . Obtain a Point Estimation , which is usually the maximum likelihood estimate;
- Based on , construct the test statistic such that when , the distribution of is known, such as , , , , etc., and it is independent of ;
- Based on , determine the shape of the rejection region according to the practical meaning of the alternative hypothesis . It is an inequality or two inequalities about , containing one or two critical values;
- Based on the significance level , calculate the rejection region of the test, i.e., determine the critical values of the inequality in step 3. Calculate the value of the test statistic based on the sample, and then determine whether the sample falls into the rejection region. If it does, reject ; otherwise, accept ; Alternatively, calculate the p-value of the test. If the p-value is less than , reject ; otherwise, accept .
Tables
Test Mean with Known Variance
| Test | Statistics | Distribution | Rejection Region |
|---|---|---|---|
Test Mean with Unknown Variance
| Test | Statistics | Distribution | Rejection Region |
|---|---|---|---|
Test Variance with Known Mean
| Test | Statistics | Distribution | Rejection Region |
|---|---|---|---|
Test Variance with Unknown Mean
| Test | Statistics | Distribution | Rejection Region |
|---|---|---|---|